
A lot of PPC advertisers misunderstand KPIs and how to use them in the planning and optimisation of campaigns. This is a serious problem because you can’t maximise performance if you don’t know which metrics truly represent success and failure. Failing to define the correct KPIs compromises your ability to see which campaigns are working and where you should optimise to improve results.
This trickles down into everything you do and potentially leads to poorly informed decisions, such as putting more budget into campaigns that aren’t working as well as you think or pausing ones doing better than your reports suggest.
In this article, we explore the most important KPIs for PPC advertising and how to identify them for every campaign goal.
What is a KPI & why are they misunderstood?
A key performance indicator (KPI) is a metric that directly aligns with the goal of your PPC strategy, campaign or ad. So, if the goal of a campaign is to sell a specific product, your primary KPI is sales of that product and no other metric is a better gauge of performance.
Unfortunately, many advertisers struggle to pinpoint the right KPIs for their campaigns and there are many reasons this can happen:
- Confusion between KPIs and other metrics
- They haven’t defined a clear goal
- Confusion between goals and objectives
- They’re distracted with vanity metrics
- The real KPIs are difficult to track or attribute
So let’s explore these in a little more detail and clear up some of the confusion.
KPIs vs metrics
Confusion between KPIs and other metrics is a common problem and we often see advertisers fretting over metrics like cost-per-click (CPC) when it has very little to do with the goal of their campaign. This is the thing about KPIs: there’s no fixed rule about what separates KPIs from other metrics other than their direct relationship with your goal.
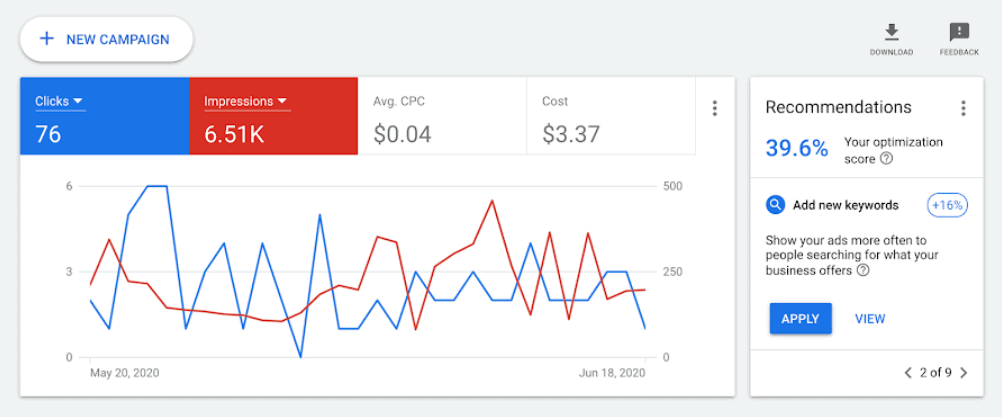
All key performance indicators (KPIs) are metrics but not all metrics are KPIs.
Later on in this article, we look at the most (common) important PPC KPIs but the real message here is that your KPIs should be obvious if you’ve defined your goal properly. In most cases, your primary KPI is the goal of your campaign. So, if the goal of your campaign is to increase conversion value, then conversion value is your primary KPI. Likewise, if your goal is to reduce cost-per-acquisition (CPA) while maintaining revenue, then CPA and revenue are your primary KPIs.
If you’re defining goals properly, your primary KPIs should align with this goal.
However, every PPC goal has a set of secondary (or supplementary) KPIs that can help you understand the performance of campaigns in greater details and determine why goals are being achieved (or not).
- Primary KPIs directly align with your goal and clearly specify whether you’re achieving it or not – in a measurable way.
- Secondary KPIs demonstrate the performance factors that contribute to your primary KPIs or help you ensure that you’re not compromising performance in other areas.
For example, if your goal is to increase PPC revenue by 10% in Q4, then revenue is clearly your primary KPI. However, you’ll also want to look at other financial metrics, including ROAS, ROI, CPA, conversion value and others, as secondary KPIs, that tell you more about the contributing factors to your PPC revenue.
Likewise, if your goal is to increase conversions by 5% for a specific product range, then conversion rates and total conversions are your primary KPIs but you could identify conversion value as a secondary KPI to ensure that you’re not simply increasing conversions without the financial reward.
Goals vs objectives
Another complication that might cause problems here is confusion between PPC goals and PPC objectives. Much like KPIs and metrics, these two terms are often used interchangeably when they mean two different (but similar) things.
- A Goal is the specific, measurable target outcome of a campaign – eg: generate £75,000 per month from Campaign A at a CPA of £120.
- An objective is a target that helps you reach your goal – eg: optimising Quality Scores in order to hit your £120 CPA target.
Every campaign should have one, clear goal and multiple objectives that will help you achieve it. If you’re unclear about these distinctions, it makes sense that you might also be confused between KPIs and metrics, which could encourage you to place too much emphasis (or the wrong emphasis) on something like Quality Scores at the expense of your real KPIs.
The dangers of vanity metrics
Vanity metrics are simply metrics that look great in reports but take your attention away from the ones that really matter. For example, you might see a campaign is winning loads of clicks or achieving low CPCs and take these metrics as a measure of success. The problem is, you didn’t get into PPC so you can pay Google for clicks or find the cheapest impressions and these metrics tell you very little about the real performance of your campaigns.
This doesn’t mean clicks and CPC aren’t useful metrics but they are two of the most misused or misunderstood.
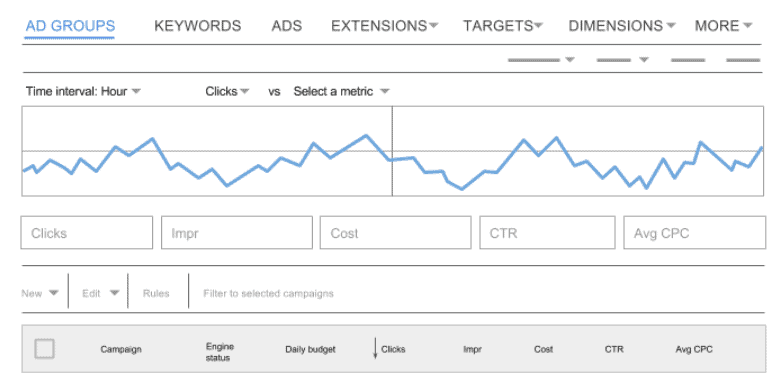
Don’t fall into the trap of only optimising for vanity metrics like clicks and CPC.
Funnily enough, the most common vanity metric in PPC is also one of the most important: conversions. Every campaign should track conversions as a measurement of what visitors do after clicking through to your landing page but conversion rate (CR) isn’t always an effective KPI. The reason for this is that conversion rate tells you nothing about the value of the conversion, how much these conversions are costing you or anything that directly measures the financial performance of your campaigns.
You could have campaigns converting like crazy and still lose money if your profit margin on each conversion is too low, your CPAs are too high or customer lifetime value doesn’t justify the initial investment.
The challenges of tracking KPIs
Defining KPIs is one thing but accurately tracking them is another challenge entirely. Earlier, we talked about a campaign goal for selling a specific product and the KPI for this campaigns being sales volumes of the same product – simple.
However, the challenge is attributing sales to ads and campaigns when the majority of purchases aren’t made directly after the click.
For example, the average eCommerce conversion tends to be around 3% and you want to run remarketing campaigns to bring previous visitors back to your website and complete the purchase. You may have separate remarketing campaigns for audiences who have visited once, people who have looked at the same page multiple times and users who added items to their basket but didn’t complete the purchase – and several others.
So the first campaign that won the initial click isn’t converting many users by itself but it is playing a crucial role in starting the customer journey and initiating your lead nurturing campaigns. If you pull the plug on this campaign, your high-converting remarketing campaigns lose the traffic they need to work with.
This is another example of how vanity metrics can cause problems (ie: assuming low conversions means poor performance) but the bigger issue here is attributing sales to every campaign and ad that contributes to the conversion.
In Google Ads, you have six attribution models that you can use to credit conversions to interaction in various ways:
- Last click: Gives all credit for the conversion to the last-clicked ad and corresponding keyword.
- First click: Gives all credit for the conversion to the first-clicked ad and corresponding keyword.
- Linear: Distributes the credit for the conversion equally across all ad interactions on the path.
- Time decay: Gives more credit to ad interactions that happened closer in time to the conversion. Credit is distributed using a 7-day half-life. In other words, an ad interaction 8 days before a conversion gets half as much credit as an ad interaction 1 day before a conversion.
- Position-based: Gives 40% of credit to both the first and last ad interactions and corresponding keywords, with the remaining 20% spread out across the other ad interactions on the path.
- Data-driven: Distributes credit for the conversion based on your past data for this conversion action. It’s different from the other models, in that it uses your account’s data to calculate the actual contribution of each interaction across the conversion path.
By default, Google Ads uses the last click model but this fails to pass credit to interactions building up to the conversion. First click does the opposite, placing all credit on the first interaction, and this would give full credit to the first campaign in our hypothetical example.
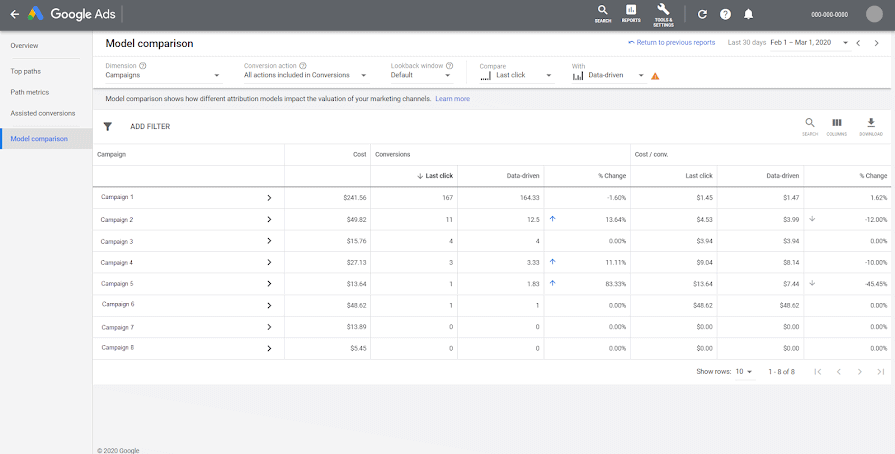
You can compare different attribution models in Google Ads using the model comparison report.
Linear attribution distributes credit equally across all interactions building up to the conversion and this gives you a far more accurate picture of which campaigns, ad groups and keywords contribute to your goals.
Then we have the time decay attribution model, which also gives credit to every interaction involved put places more value on the most recent interactions – so you still attribute contribution at every stage but place more importance on the ones that contribute most to the conversion.
What are the most important KPIs for PPC?
Hopefully, you can tell by now that the most important KPIs for any given campaign are determined by the goal you define. It’s more important that you follow this process of setting goal-driven KPIs than using any formula or list as a template.
That said, the overall goal of any PPC strategy is the generate profit and this says a lot about the KPIs you should value most.
Profitability KPIs
Profitability KPIs are the metrics that measure the financial performance of your overall advertising strategy.
- Profit: The money you bank from your advertising campaigns after expenses are accounted for.
- Revenue: The quantifiable revenue (annual, quarterly and monthly) attributed to your advertising strategy and individual campaigns.
- Profit margin: A profitability ratio (%) for measuring and comparing the financial performance of campaigns.
- Revenue growth: This maps out the increase (or decrease) or revenue over time.
There are plenty of other KPIs that could make this list but the key point is that you’re putting specific numbers on profit and revenue while comparing profitability and revenue growth over time. This is important because metrics like return on investment (ROI) don’t always correlate with profitability, especially over time.
By default, platforms like Google Ads and Facebook Advertising don’t track or report on metrics like profit or revenue – so you need to take care of this yourself.
Valuable action KPIs
The key to attributing revenue and profit to campaign performance is identifying the actions that drive financial returns. This sounds simple enough but you have to be specific if you’re going to attribute specific numbers to individual action with accuracy.
Conversions is a good blanket term for any valuable action but not all conversions are equally valuable:
- Purchases
- Preorders
- Click-and-collect reservations
- Downloads
- Table bookings
- Enquiries
- Email signups
- Free trial signups
For example, a restaurant may run a local PPC campaign with the goal of securing sixty table bookings per week, knowing that the average table booking generates £120+ revenue. The KPI of table bookings is obvious here but the restaurant understands the value of table bookings fluctuates and a percentage of bookings won’t show.
By using an average revenue benchmark, the restaurant can optimise campaigns and break down data further to determine that the average spend per booking rises to £180+ around Christmas and other times of the year, for example.
The restaurant can also retrospectively monitor weekly bookings, sales and revenue figures to track campaign performance with more accuracy and constantly update its averages.
Campaign efficiency KPIs
By the time we get to campaign efficiency KPIs, we’re starting to move away from the primary set of performance indicators and moving into secondary KPI territory.
- Return on ad spend (ROAS): This is determined by conversion value divided by ad spend.
- Return on investment (ROI): Measures campaign profitability by dividing the total revenue generated by the total campaign investment (not only ad spend).
- Cost-per-action: The average amount you pay for each conversion.
- Conversion value: The revenue (or calculated value) attributed to each conversion.
- Sales lift: Attributes sales rates to campaigns so you can monitor increases or decreases in sales numbers.
- Customer lifetime value: The average, lifetime spend of customers captured by a campaign.
Plenty more KPIs could be added to this list but the important thing to understand about campaign efficiency metrics is that, in most cases, they’re not going to be the primary KPI used to benchmark performance.
A lot of advertisers fall into the trap of optimising for return on investment (ROI) but this isn’t an effective measurement of profitability. Instead of maximising profit, optimising for ROI encourages you to achieve the highest percentage, even if revenue and profit become smaller figures.
It’s a similar story with CPA because spending less on conversions is no help if you’re simply spending less on fewer conversions, less revenue or lower profits.
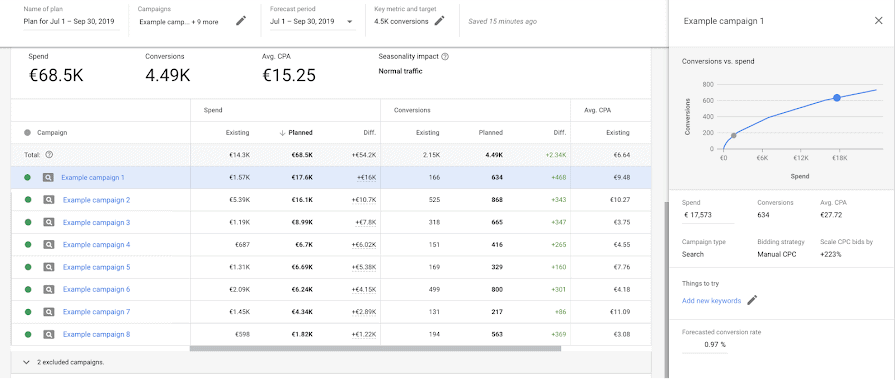
Google Ads is great for calculating and measuring metrics like cost-per-action (CPA) but you have to understand what these metrics really mean.
However, it’s perfectly reasonable to set a goal of increasing the average conversion value of your campaigns or the average customer lifetime value. As long as other performance metrics remain within tolerance, increasing these KPIs results in more revenue and profit and, as a by-product, metrics like ROAS and ROI increase.
Landing page and on-site KPIs
Arguably, landing page and on-site performance is what matters most in PPC advertising because this is where you generate revenue and a return on your ad spend. The most obvious on-site KPIs are conversion metrics it’s perfectly normal for conversion rates and total conversions to be primary KPIs for a majority of your PPC campaigns.
These aren’t the only on-site metrics that could be primary KPIs, though, and – once again – it all comes down to the goals you set.
Here are some other common on-site primary KPIs:
- Purchases: Not all conversions are purchases and it’s important to understand this distinction and track them independently.
- Repeat purchases: By attributing purchases to customers who have already bought from you in the past, you can optimise campaigns to increase repeat purchases and customer lifetime value.
- Cart abandonment: Reducing cart abandonment is a great campaign goal and it’s a perfectly legitimate primary KPI in this instance (as well as a secondary KPI for increasing conversion rates, ROAS, ROI and several other goals).
Other metrics could be added to that list, depending on the nature of your business and campaigns goals – eg: ad impressions for publishers monetising page views. But, in most cases, your primary on-site KPIs will relate to purchases and profitable conversions.
The list of secondary KPIs is much longer here and this could often include:
- Conversions: Secondary conversion goals, such as email signups or content downloads.
- Account creation: This is a great way to chase up customers who don’t complete the purchase and encourage those who do to continue buying.
- Add-to-cart: Items added to cart is a crucial secondary KPI for any eCommerce campaign.
- Cart abandonment: As mentioned above, cart abandonment is also an important secondary KPI for many campaign goals.
- Loading times: The loading times of every page and any dynamic elements (eg: shopping cart) can influence conversion rates.
- Time on page: Users can’t convert, buy or complete your goals if they’re not spending long enough on your landing page.
- Bounce rate: Most conversions include multiple page visits and bounce rates (especially combined with low time spent on page) is a red flag.
- Pages visited: This number needs to be equal to or higher than the number of pages your conversion goal covers (eg: landing page > product page > checkout > payment page > confirmation).
Depending on the tools you’re using, you could also narrow down on more granular metrics, such as CTA impressions to ensure users are seeing the most important element on your landing page and address issues – eg: making your CTA more prominent, moving it further up the page of using visual cues to direct user attention.
‘If you can’t measure it, you can’t improve it’
Business management pioneer Peter Drucker is credited with coining the phrase, “if you can’t measure it, you can’t improve it”. This is true for all business operations and you have to know what your true KPIs are if you’re going to measure the performance of PPC campaigns with accuracy.
Modern advertisers are working with more data than ever before and the danger of distractions, vanity metrics and misunderstanding KPIs increases every year.
As we’ve explained in this articles, defining primary KPIs should be relatively easy if you’re setting clear, specific PPC goals. Even still, a lot of advertisers get caught up in prioritising the wrong metrics, such as optimising for conversions when their true goal is increasing revenue or reducing cost-per-click (CPCs) when they set out to maximise ROAS.
If you’re struggling to pinpoint the primary KPIs for your PPC goals, you’re really going to have a hard time measuring the correct secondary or supplementary KPIs and metrics that build a more comprehensive picture of campaign performance.
Hopefully, this article puts you in the right direction but you can always contact us for more advice by calling our PPC team on 0161 870 2580 or catching us on Twitter via @hot_click.